

1 Introduction
A sampling profiler answers one question: where does the time go. For a large class of optimisation problems this is insufficient, because the same profile is produced by three different faults with three different remedies. A function may be stalled waiting for memory, it may be discarding work after branch mispredictions, or it may be executing a chain of dependent arithmetic at the rate the pipeline allows. The first is addressed by changing data layout, the second by removing unpredictable control flow, and the third by neither.
Distinguishing between these requires the hardware performance counters. On Linux the interface is perf stat and the matter ends there. On macOS the counters exist, the operating system programs them, and no documented interface presents them. In what follows we describe the route that does work, together with the errors we made along the way.
The example used throughout is a JBIG2 arithmetic decoder. It maintains 65536 adaptive contexts of two bytes each, which is 128 KB. The L1 data cache of a performance core on the Apple M3 Pro is also 128 KB. Since the decoder addresses that array in an order determined by pixel neighbourhoods, the hypothesis that it thrashes L1 is a natural one, and the obvious remedy is to pack the two fields into a single byte and halve the working set.
We implemented that change and measured it. It was 8% slower. In Section 8 we obtain a single counter reading which refutes the hypothesis before any code is written, and which explains why the remedy could never have worked.
2 The absence of eBPF, and the cost of DTrace
There is no eBPF for macOS. No port and no equivalent exists. Microsoft produced an implementation for Windows, in which the bytecode of the Linux toolchain is validated by the PREVAIL verifier and executed by the uBPF JIT. Nothing comparable exists for Darwin, and the accepted workaround is a Linux virtual machine.
The nearest facility native to macOS is older, and it is worth correcting a common misattribution. DTrace shipped with Solaris 10 in January 2005. It did not father eBPF: eBPF extends the BSD Packet Filter published by McCanne and Jacobson in 1992, thirteen years earlier. What DTrace influenced is bpftrace, the language in which most eBPF tracing is written today.
DTrace is present at /usr/sbin/dtrace on every Mac and is more expressive than any sampling profiler, since arbitrary function entries may be instrumented and aggregated in the kernel. Two conditions restrict it.

Figure 1: DTrace on a machine with System Integrity Protection enabled, invoked without privileges.
As Figure 1 shows, DTrace requires root on every invocation, and System Integrity Protection further restricts what may be instrumented even when that privilege is available. The first condition is tolerable at a keyboard and prohibitive in an automated measurement. Every method we describe in the remainder of this paper runs unprivileged.
3 Sampling: what sample(1) can and cannot establish
The command sample <pid> 8 -f out.txt attaches to a running process, samples call stacks at 1 kHz for eight seconds, and symbolises them. It requires no privileges and is installed by default. Figure 2 shows the result for a harness rendering 1088 scanned pages.
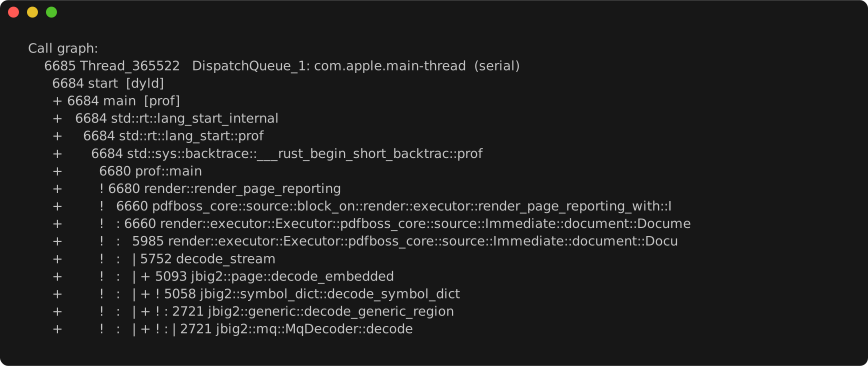
Figure 2: A fragment of the call tree, with the guide characters visible at the left margin.
One property of this output deserves attention, because it silently invalidates naive parsing. The tree is not indented with whitespace. It is drawn with the characters +, !, : and |, so a parser computing depth from ^(\s*) treats every frame as a sibling of the root. In the case measured here the consequence was that 99.99% of self time was attributed to start in dyld, which is the outermost frame present. We believed this figure for some time. The failure is not obvious on inspection, since a single large value accompanied by a scattering of small ones is also what a correct profile of a hot loop looks like. Depth must be computed across the entire guide prefix.
A second hazard appears when demangling Rust v0 symbols by hand. Back references take the form B5_, and an unbounded pattern such as B[0-9a-z]+_ consumes the substring Bitmap7pack_, silently renaming pack_rows to rows. Bounding the run to three characters is sufficient, because back reference indices are small integers written in base 62 and occupy one or two characters, whereas the identifier lengths that must survive the pass are longer than that.
Subtracting the samples attributed to each frame's children from its own total yields self time. The result is given in Figure 3 and summarised in Figure 4.
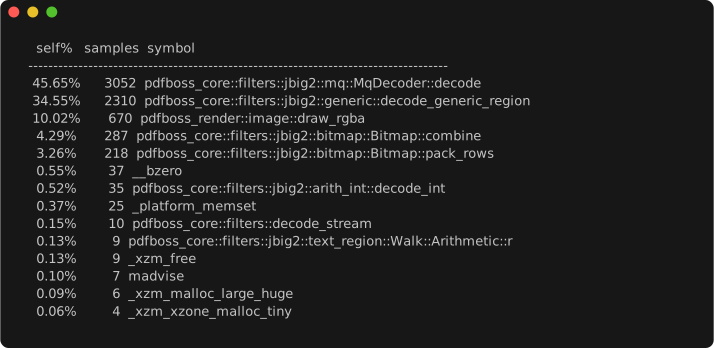
Figure 3: Flat self-time profile, 6685 samples at 1 kHz.
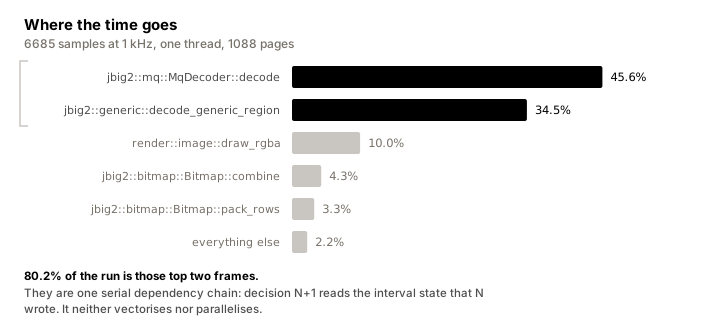
Figure 4: The same distribution. The two dominant frames account for 80.2% of the run.
Two functions account for four fifths of the run. This result is correct and it was obtained in approximately thirty seconds, but it does not discriminate between the three faults listed in Section 1. That MqDecoder::decode occupies 45.65% of the run does not indicate whether it waits on memory, discards mispredicted work, or executes dependent arithmetic.
4 Recording the counters with xctrace
xctrace is the command line interface to Instruments. It requires the full Xcode distribution rather than the Command Line Tools, and it launches and records a process without privileges.
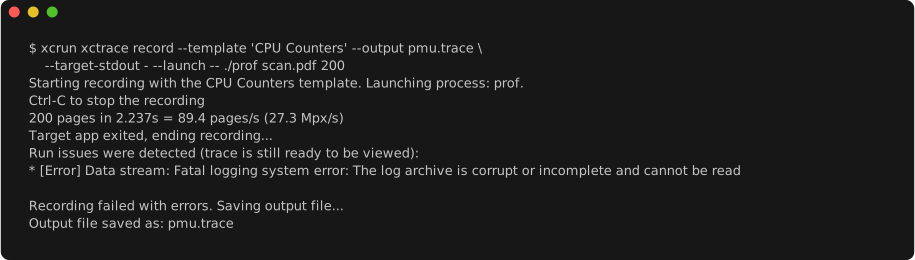
Figure 5: A complete recording. The reported failure is spurious.
The behaviour shown in Figure 5 requires comment, since it invites the destruction of valid data. Every recording on this machine terminates with [Error] Data stream: Fatal logging system error, followed by Recording failed with errors, and exits with status 2. The complaint concerns the logging subsystem and does not affect the counters. The trace is written and exports normally. Every measurement reported in this paper was obtained from a recording that announced its own failure, and the exit status should be disregarded in favour of testing whether the output file exists.
Figure 5 also quantifies the cost of observation. The harness sustains 106 pages per second unobserved and 89.4 pages per second while recording, an overhead of approximately 16%. Profiled and unprofiled runs may not be compared directly.
The CPU Counters template is the relevant one, because it performs the top-down bottleneck analysis: instruction delivery against instruction processing against discarded work, which is to say frontend against backend against wasted speculation.
5 The exported counter array
A processor counts events in hardware. It has a small number of registers, and each one is programmed to tick whenever a chosen thing happens: an instruction retires, a load misses cache, a branch is predicted wrongly. Reading a register tells us how many times that thing happened. This is the measurement Section 1 asked for, and the recording from Section 4 contains it.
The difficulty is that the export gives the numbers and withholds their meaning.
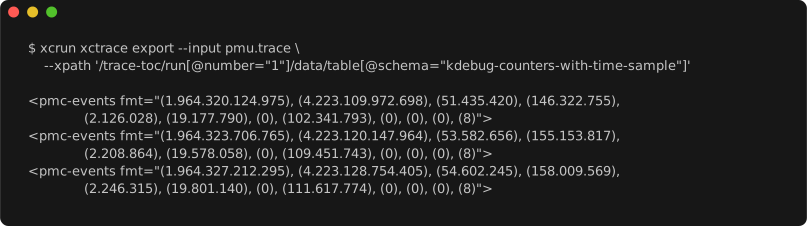
Figure 6: Three consecutive samples. The values are cumulative and unlabelled.
Each sample in Figure 6 carries twelve integers. One of them is probably cache misses, another is probably mispredicted branches, and nothing in the file says which. Twelve numbers with no names cannot be interpreted, so at this stage the recording is useless to us.
The obvious response is to search the trace for the event names from the catalogue. That search finds nothing. Neither FIXED_CYCLES nor L1D_CACHE_MISS_LD_NONSPEC occurs anywhere in the bundle, including the four 1.run archives beneath instrument_data/.
The reason is worth stating plainly, because it explains the whole shape of this problem. Instruments is a graphical application, and the trace file is written for that application to reopen. The plugin that recorded the trace already knows what it configured, so the file has no reason to repeat it. Nothing is hidden from us on purpose. We are simply reading a file that was never addressed to us.
Widening the search bears that out. The file form.template inside the bundle is a binary property list, and strings recovers the configuration of the recording from it.
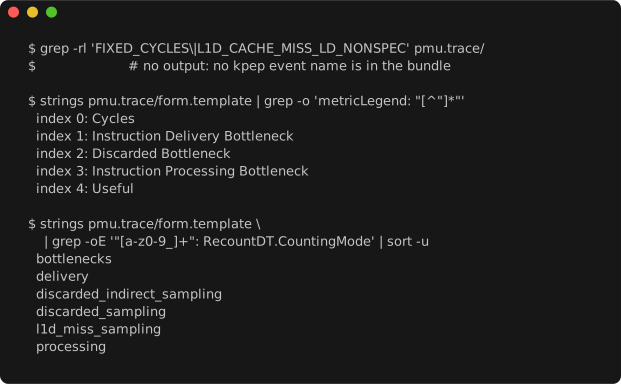
Figure 7: The template configuration recovered from the trace bundle.
Figure 7 corrects an assumption we had been carrying. The template did not program twelve raw hardware events at all. It ran a guided mode named CPU Bottlenecks at 1 kHz, and the five quantities it intends to display are derived metrics, computed from the counters rather than read directly off them. Among its six counting modes is one named l1d_miss_sampling, which will matter in Section 7.
So the names exist and the positions do not. Twelve slots correspond to five legend entries and six counting modes, and a dictionary named areaGraphSepcIndexTometricIndex reorders them once more before display. Recovering that mapping by reading the file is not practical. Section 7 obtains it by experiment instead.
6 The event catalogue in /usr/share/kpep
The directory /usr/share/kpep/ contains Apple's database of performance monitoring events. It is the closest equivalent to perf list available on macOS, and no Apple documentation known to the author refers to it.
It holds one property list per microarchitecture together with symlinks that map a CPU identity onto the appropriate file. The symlink name is composed of three sysctl values: the CPU type in hexadecimal, the subtype in decimal, and the family in hexadecimal.
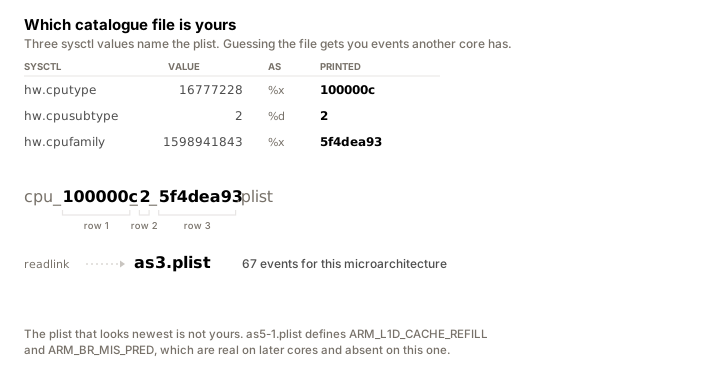
Figure 8: Composing the catalogue filename for this processor. Each highlighted segment comes from one sysctl.
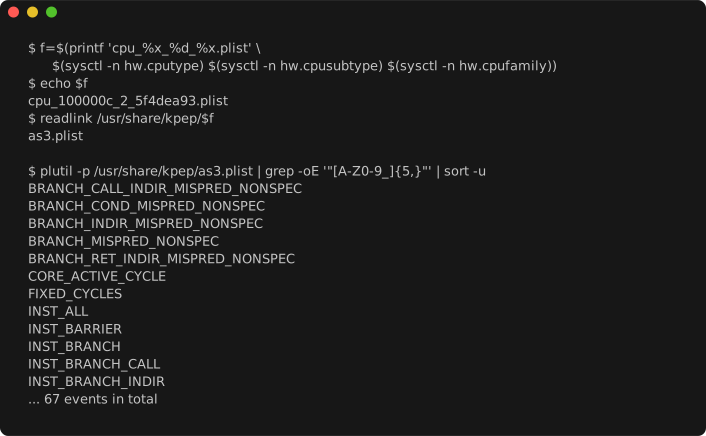
Figure 9: Resolving the catalogue for this processor and listing part of its contents.
The symlink must be resolved rather than a plausible file selected by inspection. An earlier attempt read as5-1.plist because its name suggested a more recent revision, and recorded the event names ARM_STALL_BACKEND, ARM_L1D_CACHE_REFILL and ARM_BR_MIS_PRED. These are genuine architectural event names on newer cores and are absent on this one. As Figure 9 shows, the M3 Pro resolves to as3.plist, which defines 67 events under Apple's own names, among them L1D_CACHE_MISS_LD_NONSPEC, BRANCH_COND_MISPRED_NONSPEC and MAP_DISPATCH_BUBBLE_IC. The suffix _NONSPEC denotes retired, non-speculative events, which are the appropriate choice when counting work the program actually performed.
At this point a catalogue of countable events is available, and an export of twelve unlabelled values. Neither is useful in isolation.
7 Identifying the slots by calibration
The problem left by Section 5 is that we hold twelve numbers and no labels. The way out does not require the labels.
Suppose we write a program that does one thing and almost nothing else: it reads memory in a pattern where every single load misses cache. We record it, and we look at which of the twelve numbers grows large. Whatever that number counts, it is closely related to cache misses, because cache misses are nearly all this program does. We have identified a slot without ever being told its name.
The same procedure finds the branch counter. We run a program that mispredicts constantly and does little else, and a second slot separates itself from the rest.
The third program is a control, and it is the one that is easy to omit. It touches no memory and mispredicts nothing, so its readings show what each slot does when neither effect is present. Without it we would have nothing to compare against, and no way to judge whether a given reading is large. That turns out to matter here. The control still reads 0.0834 on the cache slot rather than zero, so when the decoder reads 0.0157 on the same slot in Section 8, it is not merely low. It is below the level of a program that performs no memory access at all.
The counters are therefore labelled by the workloads rather than by the file. Figure 10 shows the commands involved.
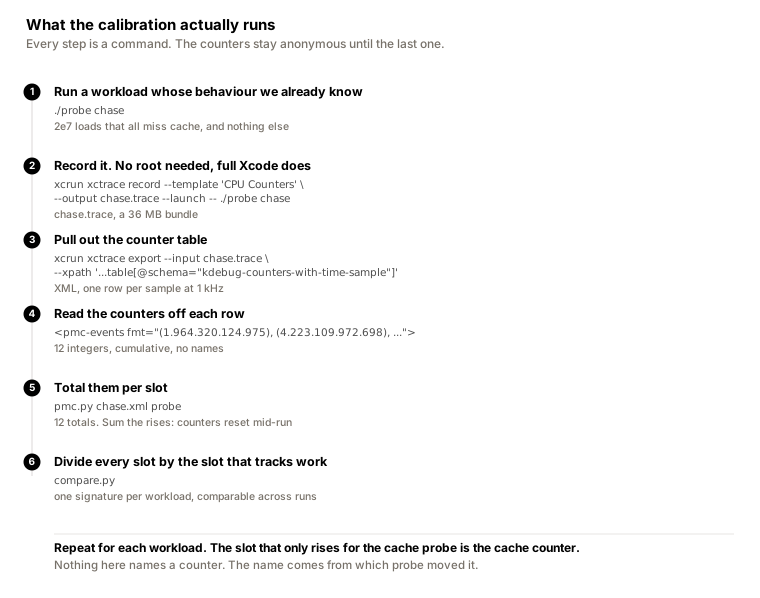
Figure 10: The calibration procedure. No step in it names a counter.
Two details in Figure 9 are easy to get wrong. The counters are cumulative and are reset at intervals during a run, so the total for a slot is the sum of its rises rather than the difference between the first and last sample. And a slot total means nothing on its own, because a longer run produces larger numbers everywhere. Dividing every slot by the slot that grows in proportion to work makes the recordings comparable with each other.
7.1 The probe workloads
Three workloads suffice, and we can express them in approximately sixty lines of C. Each is given in full below, since the details that make them work are not obvious and Section 7.2 describes what happens when they are omitted.
The first, alu, executes 6e9 instructions with no memory traffic and one perfectly predicted branch. Writing the loop in assembly fixes the instruction count exactly, which is what allows it to serve as the unit of work in Section 7.3.
#define ALU_ITERS 3000000000L  // 2 instructions each

static void alu(long iters) {
  long n = iters;
  __asm__ volatile(
      "1:\n\t"
      "subs %[n], %[n], #1\n\t"
      "b.ne 1b\n\t"
      : [n] "+r"(n)
      :
      : "cc");
}
The second, chase, performs 2e7 dependent loads around a 256 MB cycle. Each load supplies the address of the next, so the processor cannot overlap them, and a stride coprime to the buffer length places consecutive accesses far apart so that the prefetcher cannot follow. Coprimality does a second and more important job. Because the length is a power of two and the stride is odd, repeatedly adding the stride modulo the length reaches every element exactly once before returning to its starting point. The walk is therefore a single cycle through the entire 256 MB rather than a short loop confined to part of it, and a short loop would fit in cache and measure nothing. The cycle is constructed in one linear pass rather than by shuffling, for the reason given in Section 7.2.
#define CHASE_STEPS 20000000L
#define CHASE_BYTES (256UL << 20)

static void chase(void) {
  size_t n = CHASE_BYTES / sizeof(size_t);
  size_t *a = malloc(CHASE_BYTES);
  if (!a) return;
  const size_t stride = 9973;  // prime, and n is a power of two
  size_t p = 0;
  for (size_t i = 0; i < n; i++) {
    size_t next = (p + stride) & (n - 1);
    a[p] = next;
    p = next;
  }
  size_t q = 0, acc = 0;
  for (long s = 0; s < CHASE_STEPS; s++) {
    q = a[q];
    acc += q;
  }
  printf("chase acc %zu\n", acc);
  free(a);
}
The third, branch, takes 2e8 branches on the high bit of a linear congruential generator, half of which are unpredictable. Two details are load-bearing. The data comes from a generator rather than a table, and the two arms of the conditional contain different inline assembly. Section 7.2 explains why the obvious formulations of both fail.
#define BRANCH_ITERS 200000000L

static void branch(void) {
  unsigned x = 1;
  long taken = 0, missed = 0;
  for (long i = 0; i < BRANCH_ITERS; i++) {
    x = x * 1664525u + 1013904223u;
    if (x >> 31) {
      __asm__ volatile("nop" ::: "memory");
      taken++;
    } else {
      __asm__ volatile("nop\n\tnop" ::: "memory");
      missed++;
    }
  }
  printf("branch taken %ld missed %ld\n", taken, missed);
}
Compiled with clang -O2, the generator produces 100006411 taken branches against 99993589 not taken. The even split is not cosmetic. A predictor tracks whichever outcome dominates, so a stream biased nine to one is predicted correctly nine times in ten and mispredicts rarely. Only a stream that is evenly split and free of any repeating pattern leaves the predictor at chance, and it is the mispredictions that follow which make the slot visible against the others. Each workload is then recorded separately, and every slot is divided by the slot that scales linearly when the ALU loop is quadrupled.
7.2 Interference from the setup code and the compiler
Three effects corrupted our first version of these probes, and we required a rebuild to discover each of them.
The initial chase constructed its cycle with a Fisher-Yates shuffle, which called rand() 33 million times. The setup therefore contributed memory traffic of an entirely different character to the traffic under measurement. Constructing the cycle with a coprime stride in a single linear pass removes the problem.
A table of random bytes is learned by the branch predictor, which observes the same 64 KB cycle repeatedly. Data for the branch probe must come from a generator that does not repeat within the run.
Identical if and else arms are tail-merged by clang into a branchless conditional select. In that form 2e8 nominally unpredictable branches completed in 0.15 seconds, one per cycle, mispredicting nothing at all. Placing different inline assembly in each arm preserves the branch. The same work then requires 0.79 seconds, and the additional 0.64 seconds corresponds to 1e8 mispredictions at approximately 26 cycles each. That figure is worth a moment, since it is the cost being measured: a mispredicted branch discards every instruction the processor has speculatively issued behind it, and the pipeline must be refilled from the correct address. Twenty-six cycles is consistent with the depth of a wide out-of-order core.
7.3 Results
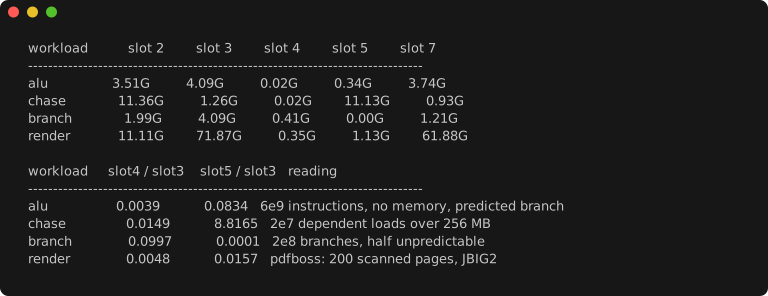
Figure 11: Slot totals and normalised ratios for the three probes and the decoder.
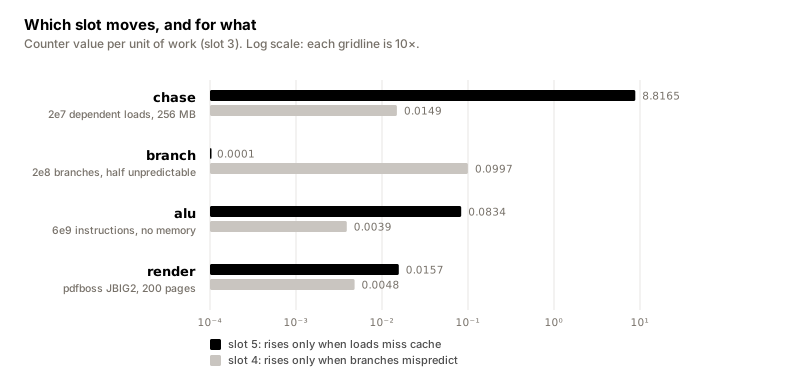
Figure 12: Counter response per unit of work. Each gridline is a factor of ten.
Figures 11 and 10 identify two slots. Slot 5 rises by three orders of magnitude for the pointer chase and reads 0.0001 for the branch probe, and therefore counts loads that miss cache. This is consistent with the l1d_miss_sampling counting mode recovered in Figure 7. Slot 4 peaks for the branch probe at 25 times the rate of the ALU loop and remains flat elsewhere, and therefore counts branch mispredictions.
8 Application to the decoder
The decoder measures 0.0157 on slot 5 and 0.0048 on slot 4. The memory-bound probe reads 8.8165 on slot 5, a factor of 560 higher, and the branch probe reads 0.0997 on slot 4, a factor of 21 higher. The decoder is therefore neither memory bound nor branch bound, and on slot 5 it falls below even the loop that performs no memory access whatsoever.
This is the answer to the question posed in Section 1. The decoder was never waiting on L1, and halving a table on which nothing was stalling could only add the cost of the additional arithmetic. That cost was 8%. Having excluded two of the three candidate faults, and with Figure 4 placing 80.2% of the run in two functions, what remains is a dependency chain: decision N+1 reads the interval state that decision N wrote. This is also why the arithmetic decoder does not vectorise, and why a SIMD implementation would return nothing.
One qualification is necessary. The absolute counts obtained from the command line interface cannot be trusted. The counters are reset between samples, with the consequence that summed deltas and the difference between the first and last sample disagree by a factor of between two and four on the same recording, and neither agrees with the instruction count that can be derived by hand for the ALU loop. The ratios survive this, and the ratios are sufficient to distinguish memory bound from branch bound from neither. Absolute figures require the graphical interface, where the columns carry names.
9 Processor Trace
The template list includes Processor Trace, which is the Apple Silicon counterpart to Intel PT: a hardware record of the exact instruction path rather than a statistical sample of it. We initially assumed it to require an M4, and very nearly published that assumption.

Figure 13: Processor Trace declining to record on this machine.
Figure 13 shows that the restriction is not a hardware one. The operating system emits format 7.3 and the installed Xcode consumes format 7.1. The remedy is a newer Xcode rather than newer silicon, and an assumption of the form "probably unsupported" is a hypothesis with the same standing as any other.
10 Frequency scaling
One measurement discipline is worth stating separately, since it invalidates results silently. When we timed the ALU probe we obtained 0.62 seconds, and subsequently 0.25 seconds for identical work. This is not noise. The first run is placed on an efficiency core at a low clock, before the scheduler has any reason to do otherwise. Once the machine is warm the scaling is exact: 0.25, 0.50 and 1.00 seconds for one, two and four times the iteration count.
Every workload must therefore be executed at least once before any timing derived from it is believed.
11 Choosing an instrument
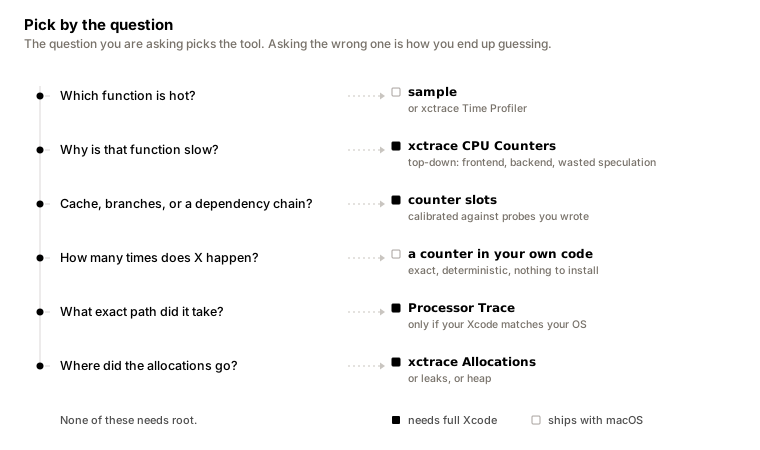
Figure 14: The question determines the instrument. None of the six requires root.
The fourth entry in Figure 14 is not a concession. Where the question is a count rather than a duration, a counter compiled into the program behind a feature flag is exact and deterministic, requires no privileges, no XML, and no correspondence between the versions of Xcode and the operating system. We reach for it more frequently than for any of the others.
The instrumentation available on macOS is thinner than the Linux equivalent and considerably less documented. The useful part is a property list to which nothing refers, feeding an export that omits its own column names. The counters are nevertheless real, the catalogue is present on the disk, and approximately twenty minutes spent writing calibration probes removes the need to guess.
The measurement reported in Section 8 took one recording. The hypothesis it refutes took twenty minutes and a revert commit.